Is Section 18115 really doing anything?
On June 4th, the U.S. Department of Health and Human Services (HHS) released new guidance requiring laboratories to include relevant demographic data, such as age and race, on every COVID-19 test. As specified in the Coronavirus Aid, Relief, and Economic Security (CARES) ActSection 18115,these changes went into effect on August 1st. But did anythingreallyhappen?
As a follow up to theprevious articleon missing reported race data in COVID-19 tests nationwide, we wanted to see the significant effects (if any) of the new federal guidance passed in the CARES Act Section 18115. Previously, we found large gaps in the aggregate data across the United States. From this, we asked if anything could be done at individual laboratories or medical testing centers to compensate for the gap. Now, we seek to investigate the impact of the new federal regulation on reporting race data.
Data Comparisons, Before and After 18115
Section 18115 may actually be impacting the level of reported race data nationwide… But is it enough?
From July 26th to August 26th, positive COVID-19 cases increased by over 1.5 million but only about 1 million had associated race data.
In the United States, the percent of cases with associated race data has varied over time:
- cumulative as of August 26th: 55.65%
- only between July 26th and August 26th: 66.10%
- cumulative as of July 26th: 51.75%
[[insert bar graph]](https://chart-studio.plotly.com/~brianwilliams2022/17.embed)
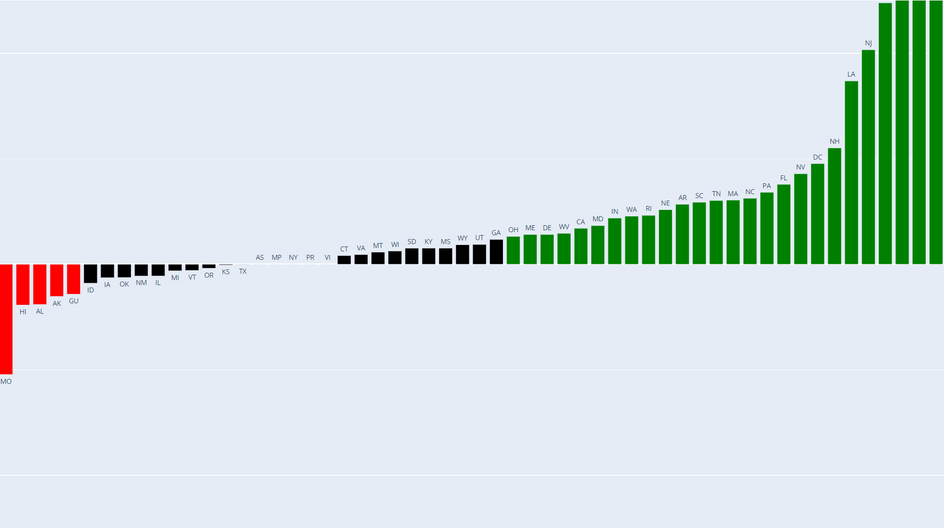
This visualization shows the difference of percents of cases where race data is known, per state. The number represented in each bar is the percent difference in cases with associated race between two different periods: fromJuly 26th to August 26thand from the beginning of data collection up until July 26th.
For example, let’s say that a given state’s total cases rose from July to August by x, and of those cases, there is a subsection where race data is unknown. Let’s say this subsection of unknown race data increases by y. I calculated 1 - (y/x), and compared that same calculation instead with the cumulative period from toward the beginning of the pandemic (late March) to July 26th.
Some of these values are negative because the total number of Other and Unknown cases actuallyincreasesfrom July to August at a greater percentage compared to the beginning of the pandemic. This is pretty alarming.
Please note that North Dakota (ND) seems to have a very large value: 87%. This is due to the fact that North Dakota only very recently started reporting race data foranyof their cases.
But why?
This seems unusual but I think it can be explained by retroactive revisions to the data (either by individual laboratories or a state’s Department of Public Health) which would move cases from these categories to their accurate racial category.
For example, if a scientist was able to confirm a case or a set of cases belonged to certain demographic after the total number of cases had already been reported, you would simply move cases over to their respective categories. Maybe in certain situations, backlogs of case data prevent labs from sorting cases by demographic data before state deadlines but as time goes along, they are able to update their reported case data. This doesn’t seem to happen in many states and the testing efficiency problem could easily be a bigger and more widespread problem than I am expressing/speculating here.
Here’s a regional breakdown of the same data.
[[insert color map]](http://plotly.com/~brianwilliams2022/35.embed)
Discussion: Almost too little, too late
So far, the national average of cases with race data increased by about 15% directly following the period Section 18115 went into effect, compared to reported race averages during the rest of the pandemic.
Is this difference big enough? And how much of it can be directly attributed to Section 18115? To be quite honest… I’m not sure.
Though somewhat significant, the impact is almost too little too late. Just imagine what we’re not seeing, and the things we’ve *already* missed. Before August, there were more than 2 million Covid-19 tests that were unidentifiable by race. This type of federal guidance should have been in place since February and at the latest, the beginning of March.
It doesn’t seem like we will have access to complete, accurate, and thorough data sets into the foreseeable future for many reasons starting at the laboratory level stretching all the way to the federal level. I just hope policymakers, publicly obligated to support our communities, are doing their best trying to walk in the dark during this pandemic.
Sources


